
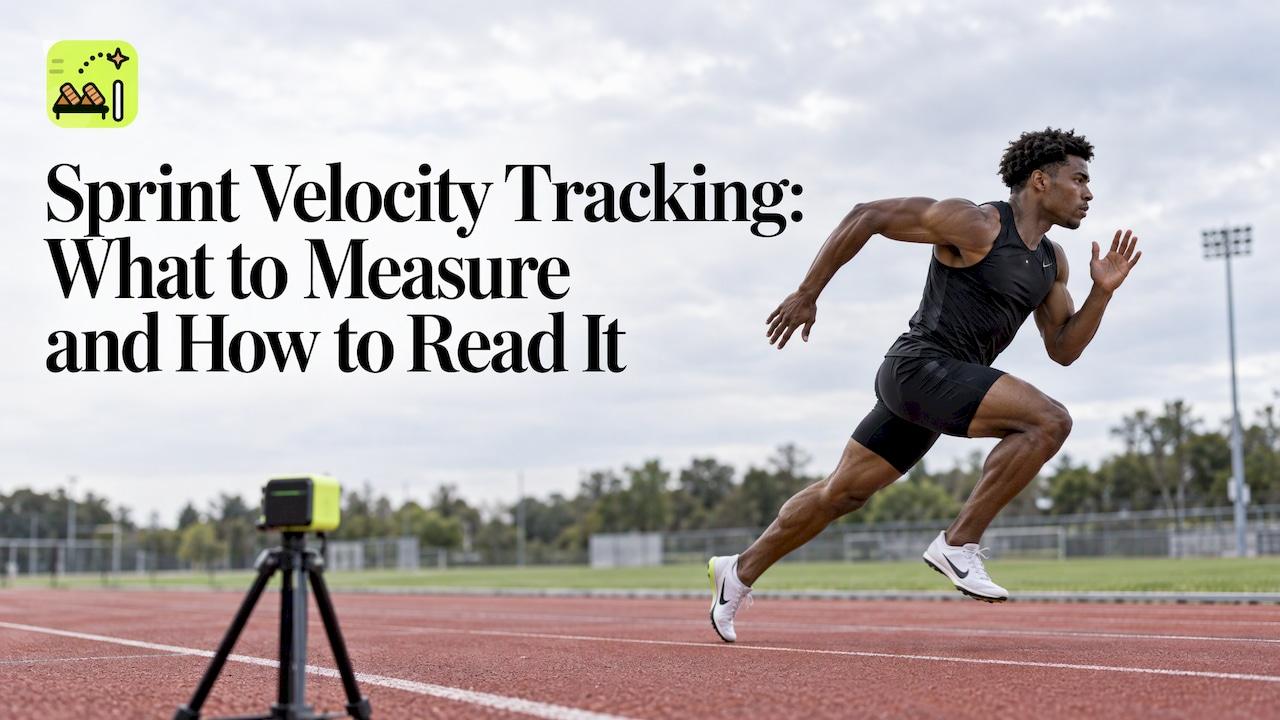
Sprint velocity tracking means recording how fast an athlete moves at each point of a run, not just how long the run took. A finish time tells you the result. A velocity curve tells you where the result was made or lost: in the first 10 meters, at top speed, or in the final stretch. This guide covers which numbers are worth tracking, how accurate each measurement method is, and how to compare sessions without fooling yourself. If your velocity data points to the start, our free sprint video analysis tool, STRIDE / LAB, reviews your start footage frame by frame in your browser.
TL;DR
- Track velocity by phase: acceleration over the first 10 m, maximum running speed, and speed loss over the last 40 m of a 100 m race.
- Laser, radar, timing gates and video are generally valid for straight sprints of about 20 to 70 m. GPS is the least dependable for short sprints.
- A 2% velocity error is large in sprinting terms, so match the method to the decision you want to make.
- Keep conditions identical between tests (surface, wind, warm-up, start position) or the comparison is meaningless.
- Use velocity data to find the phase to work on, then use video to see the movement behind the number.
Table of Contents
- What sprint velocity tracking actually measures
- The three phases and the numbers that matter
- Ways to measure sprint velocity
- How accurate is each method?
- How often to test and how to compare results
- Turning velocity data into training decisions
- When the number points to your start
- Practical setup for video-based tracking
- FAQ
- Sources
What sprint velocity tracking actually measures
A stopwatch gives you one number per run. Velocity tracking breaks the run into pieces. Split times are the time to reach a given distance, such as 30 m. Interval velocity is the average speed over a section, such as 50 to 60 m. Momentary velocity is the speed at a single instant.
Researchers using a laser device sampling at 100 Hz (100 readings per second) can obtain split and interval times, mean interval velocities and momentary velocities, which lets them see how maximum velocity changes across a race. The same group reanalyzed Usain Bolt's 9.58 s world record from Berlin in 2009. His peak of 12.32 m/s came at the 52 m mark, and he held maximum velocity across five consecutive 10 m sections from 50 to 100 m.
That is why two sprinters with the same 100 m time can need very different training. One may accelerate hard and fade. Another may start slowly and reach a higher top speed. The finish time hides the difference. The velocity curve shows it.
The three phases and the numbers that matter
A 100 m sprint has distinct phases with different performance determinants. A World Athletics follow-up to the FAST project recommends one simple metric for each:
| Phase | Metric | What it tells you |
|---|---|---|
| 1. Acceleration | Mean acceleration over the first 10 m (A10) | How effectively you get moving out of the blocks |
| 2. Maximum speed | Maximum running speed (Vmax) | Your speed ceiling |
| 3. Speed maintenance | Percentage of speed lost over the last 40 m | How well you hold speed under fatigue |
Those are useful because each one points to a different kind of work. A weak A10 points to the start and early drive. A low Vmax points to speed and the strength and power that support it. A big loss in the last 40 m points to speed endurance.
How the phases play out in elite sprinting
A kinematic study published by World Athletics split elite 100 m runs into seven zones: initial acceleration (0 to 20 m), extended acceleration (20 to 40 m), initial peak velocity (40 to 50 m), two velocity regulation zones (50 to 70 m), maximum velocity (70 to 80 m) and deceleration (80 to 100 m). It also found that stride length contributes more to the velocity curve than stride frequency.

Two takeaways for everyday athletes. First, nobody holds top speed for long, and slowing down late is normal. Winning often comes down to who slows least. Second, chasing a faster turnover alone is not the answer. In that same study, stride frequency above 90% of its maximum in the first 10 m negatively affected the relationship with velocity. Pushing cadence too early can cost you.
Ways to measure sprint velocity
Before electronic systems, coaches measured stride length from spike marks in cinder tracks and counted strides in timed runs, rough methods with significant error. Three-dimensional kinematic analysis was the costly gold standard, but it captured only a short section of the track. Today the options fall into these types:
| Method | Strength | Watch out for |
|---|---|---|
| Laser or radar | Continuous speed curve, very precise | Specialist equipment, set up behind the athlete on a straight |
| Timing gates (photocells) | Accurate split times at set distances | Only gives averages between gates, so gate placement matters |
| Video analysis | Cheap, shows the movement as well as the speed | Needs a steady camera, a known frame rate and a clear view |
| GPS and similar wearables | Convenient for field sessions and team sport | Weakest for short, fast sprints |
Smartphone video sits in the middle and is the one most athletes can actually use every week. A 2016 validation of a smartphone app against timing lights over flying 10 m sprints found excellent agreement (ICC 0.93) with a small systematic bias of 0.13 s, so it worked as a low-cost tool as long as the bias was taken into account. ICC is a reliability score where 1.0 is perfect agreement.
How accurate is each method?
Accuracy decides whether a change in your numbers is real. A review by Haugen and Buchheit reports that video timing reached ICC above 0.98 at 50 to 100 Hz, radar correlated at r² = 0.99 with photocells, and a laser system showed ICC of 0.96 to 0.99. The same review notes GPS validity falls with lower sample rate, higher speed, shorter duration and more changes of direction, and that dropping from 10 Hz to 5 Hz can raise error two to three times.
A more recent systematic review found radar and laser, timing gates and video analysis generally valid and reliable for linear sprints of 20 to 70 m, while GPS and local positioning results were not acceptable in most studies. Smartphone video differences ranged from 0.25 to 1.12 km/h, with ICCs of 0.92 to 0.99.
GPS also depends on distance. In a study of 24 female athletes, maximum sprint speed error was smaller over an 80 m test (mean absolute percent error 3.5%) than over a 30 m test (5.5%). If you must use a wearable, give the athlete room to reach top speed.

Why small errors matter
In sprinting, small numbers are big. Haugen and Buchheit point out that a 2% error in sprint velocity over 20 m is the difference between the 50th and 70th percentile of performance, and twice the smallest worthwhile change. So decide first what you want to detect. Spotting a 5% jump after a block of training is easy. Spotting a 1% gain needs top-quality equipment and strict repetition.
Do not swap devices mid-season
A 2024 study of 30 elite youth soccer players ran 30 m sprints against a radar criterion. GNSS showed no systematic bias, timing gates a small one, and a magnetic system overestimated speed. The limits of agreement were too wide for any device to be swapped for another when judging an individual. All devices were reliable from trial to trial, so they suit tracking change over time. The practical rule: pick one method and stay with it.
Gate layout matters too. Haugen and colleagues found timing setups covering only the first 15 to 20 m were less reliable than those covering the first 25 to 40 m, and that checkpoints at 10, 20 and 30 m are enough for valid, reliable sprint mechanical outputs in team-sport athletes.
How often to test and how to compare results
Velocity data is only as good as the comparison. A few rules keep it honest:
- Standardize the setup. Same surface, footwear, warm-up, start position and distance every time. Record wind and temperature when you can.
- Test rested. A fatigued session compares a tired athlete with a fresh one, not one technique with another.
- Use the same method. Switching from gates to video mid-block adds device error on top of real change.
- Look at trends, not single runs. One run can be a good day or a bad day. Three to five rounds of the same test show where you really are.
- Judge change against noise. Over a year, within-athlete differences can be smaller than normal variation, the smallest worthwhile change and effects of wind and monitoring method, so a small shift may not be a real one.
A workable rhythm for most athletes is a short standardized test (a 10 m acceleration run and a flying 20 to 30 m run) every few weeks, plus video of regular sessions. Tests too close together mostly measure fatigue.
Turning velocity data into training decisions
The point of tracking is to change what you do on Tuesday. The University of Ljubljana authors argue that training should be modified based on the precise course of maximum speed and its determinants, step length and frequency, to raise both top speed and the strength and power qualities behind it.
A 2019 review on elite sprint training gives the typical prescription for each quality. These are elite-level guidelines, so scale volume to your own level:
| Quality | Distance | Intensity | Recovery |
|---|---|---|---|
| Acceleration | 10 to 50 m | Above 98% | 2 to 7 min |
| Maximal velocity | 10 to 30 m, from a 20 to 40 m flying start | Maximal | 4 to 15 min |
| Sprint-specific endurance | 80 to 150 m | Above 95% | 8 to 30 min |
Here is how that reads against your data:
- A10 lags behind your other numbers: focus on the start and the first steps, where technique is most visible on video.
- Vmax is flat across several blocks: add flying sprints and the strength and power work that supports them.
- Speed loss in the last 40 m is large: work on sprint-specific endurance, with the long recoveries it needs.
The numbers say where the problem is. They do not say what is wrong with the movement. That takes video.
When the number points to your start
Velocity tracking tells you that the first 10 m is slow. It cannot tell you whether your shin angle is off at set, your first step lands too far in front, or your torso rises too soon. For those questions, you need to see the frames.
STRIDE / LAB is a free, in-browser sprint video analysis tool. Upload a clip and it tracks your pose frame by frame, detects the phases of the sprint start, reports movement measurements and gives evidence-based coaching cues you can take to your next session. The analysis runs on your device, there is no account and nothing to buy, and you can export a report to keep alongside your test log.
It also labels measurements as estimates, notes when tracking is uncertain, and does not hand you an overall grade. That keeps your attention on specific observations and the next thing to try. Coaches can use the exported reports to compare an athlete's starts across weeks, using the same camera position each time.

Film your next block of starts and analyze your sprint start with STRIDE / LAB. For clean results, shoot from the side with the camera still, at the athlete's hip height, with the whole body in frame from set to the end of the drive phase.
Practical setup for video-based tracking
If you track velocity with video, a few details decide whether the footage is trustworthy:
- Frame rate: use the highest your phone offers. Reliable video timing in the research was reported at 50 to 100 Hz.
- Camera position: perpendicular to the lane, tripod-mounted, with no zoom changes during a session.
- Reference marks: cones at known distances (such as 10, 20 and 30 m) let you read splits from the footage.
- Lighting and clothing: fitted clothing and good light help pose tracking and make joints easier to see.
- Consistency: the same spot, angle and distance every session.
When you know the 2% rule, you also know to read video-derived numbers as estimates and look for repeated patterns rather than reacting to one clip.
FAQ
What is sprint velocity tracking?
It is measuring speed at points along a sprint instead of only the total time. You get split times, interval velocities and sometimes momentary velocity, which show where an athlete accelerates, peaks and slows.
What are the most useful sprint velocity metrics?
For a 100 m sprint, a World Athletics follow-up recommends mean acceleration over the first 10 m, maximum running speed, and percentage speed loss over the last 40 m. Together they cover the start, the top end and the finish.
Can I track sprint velocity with a smartphone?
Yes, with limits. A validation study found a smartphone app agreed well with timing lights over flying 10 m sprints but read about 0.13 s low, so use one method consistently and read results as trends. A steady tripod and a high frame rate help.
How often should I test?
Every few weeks is enough for most athletes, using the same standardized test each time. Changing conditions such as wind, surface or fatigue can create false changes, so keep everything else the same.
Is sprint velocity tracking the same as agile sprint velocity?
No. In software teams, velocity counts story points finished per sprint. In track and field it is the speed of an athlete's body, measured in meters per second, over a run.
Sources
- Multicomponent Velocity Measurement for Linear Sprinting (PMC, 2023)
- A scientific follow-up of sprinting abilities, FAST project (World Athletics)
- Optimisation of performance through kinematic analysis (World Athletics, 2007)
- Technology for supporting the coaching of the sprints (World Athletics, 2009)
- Validity of a smartphone-based application for determining sprint performance (PMC, 2016)
- Sprint running performance monitoring: methodological and practical considerations (Haugen and Buchheit, 2016)
- Assessing anaerobic speed reserve: a systematic review (PLOS ONE, 2024)
- Accuracy assessment of a GPS device for maximum sprint speed (PMC, 2020)
- Assessing maximal sprinting speed in soccer (Taylor & Francis, 2024)
- Power-force-velocity profiling of sprinting athletes (PubMed)
- The training and development of elite sprint performance (PMC, 2019)